Have we ever wondered how much it costs to tap water from natural sources like springs and wells? Well, if you say that the water we receive at our houses is for free of cost, then you may need to read further to know the number of works that take place at different levels of government and by other institutions as a result of which we get accessible water from the nearest delivery points.
In 2016, the Keystone Foundation initiated a three month pilot study of the economics of water supply to off-grid habitations in the Nilgiris district of Tamil Nadu, India as a part of its work on Springs in the Nilgiris region. When the costs incurred to set up and operate a water supply system in a region were considered, it was surprising to note the number of efforts that gets pooled in to deliver ‘water’ which is one the most basic needs of the people. It involves planning and execution of water supply system infrastructure by the Water Board met either from the Central or State funds or both. The operation and maintenance of the water supply system comes under the responsibility of the local governing body i.e. Panchayats. Figure-1 gives a glimpse at stages of cost data collected from different governing bodies including the money spent from the household pockets from sample villages with diverse water sources like springs, dug-wells and combination of both.
Figure-1: Process involved in Data Collection (Costs incurred by different institutions)

From a total of 33 villages in Hubbathalai panchayat, Coonoor taluk three villages namely Chinna Karumpalam, Halorai and Jevana Gowder Lane were selected for the study. Each of the village had unique water supply systems like spring, spring & well and well only source respectively. The panchayat and the Water Board let us access all the possible cost data. All disaggregated costs related to the provision of water supply to each sample villages could be collected only from the year 1993-94 whereas the water supply systems in the region were established as early as 1982-83. The unit cost of water pertaining to each village was estimated using the Life Cycle Cost Approach from the Water Sanitation and Hygiene Cost project (WASHCost).
From the case studies, it was seen that the methodology adapted to the local context from the WASHCost Project seemed to be robust across different water supply sources. It was observed that the water supply systems in the hilly region have longer life compared to the ones in the plains where the WASHCost, India study was conducted. This is due to the large share of expenditure incurred for operations and capital maintenance rather than investing only on new Capital Hardware. Out of the total funds allocated to the provision of water supply to the villages, nearly 50 percent of which goes in for regular operations and minor maintenance as shown in figure-2.
Figure-2: Cost composition of Water Supply system in sample villages
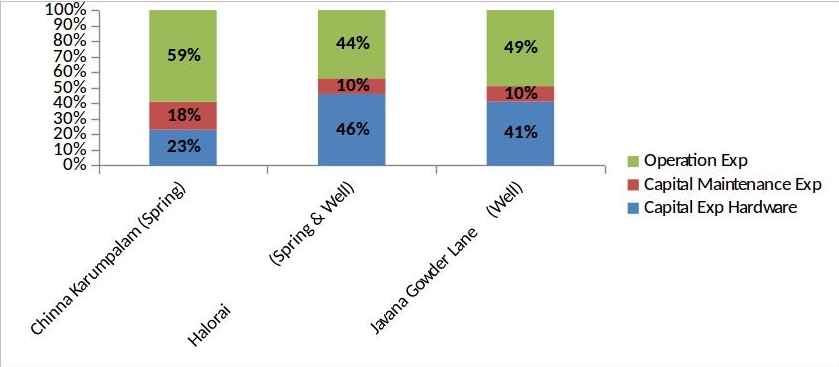
Note: The costs incurred were mainly categorised under Capital Expenditure Hardware, Capital Maintenance Expenditure and Operations & Maintenance Expenditure. There was no Cost of Capital as all expenditures were directly met from Central and State funds, also the availability of cost data on Capital Expenditure Software, Direct and Indirect expenses like staff salaries were inadequate.
The unit costs that includes fixed and recurring were estimated using financial and economic analysis. ‘Financial cost’ includes only the public investments while ‘Economic cost’ includes both public and household investments. Also, the unit costs were estimated with respect to the quantity received as per the norms of Tamil Nadu Water and Drainage Board (TWAD) and from the Household survey respectively. Data on the amount of water actually supplied to the different habitations is not available with any agency. Table-1 gives the estimated unit cost of water per 1000 liters for the three villages.
Table-1: Cost per unit of water
|
TWAD norms Quantity (liters per capita per day) |
Household survey Quantity (liters per capita per day) |
|||||
|
Chinna Karumpalam |
Halorai |
Javana Gowder Lane |
Chinna Karumpalam |
Halorai |
Javana Gowder Lane |
|
|
(40 lpcd) |
(40lpcd) |
(40 lpcd) |
(52.5 lpcd) |
(58.3lpcd) |
(12.12 lpcd) |
|
| Financial cost (Rs./1000 liters) |
12.74 |
18.04 |
36.05 |
9.71 |
12.38 |
118.94 |
| Economic cost
(Rs./1000 liters) |
23.74 |
31.63 |
108.51 |
18.09 |
21.7 |
357.98 |
| Ratio of Economic to Financial cost |
1.86 |
1.75 |
3.01 |
1.86 |
1.75 |
3.01 |
Note:*Unit of water= 1000 liters=1 cubic meter.
*Quantity of water is measured in terms of liters per capita per day (lpcd).
*Quantity of water used by households is the weighted average of water use in monsoon and summer.
*Economic cost along with public investments includes Household Capital expenditure, Household Operation & Maintenance expenditure and also the time taken by households to fetch water from the delivery point/source evaluated in terms of “Opportunity cost of time” i.e. village wage rates.
The difference between the two costs estimated using financial and economic analysis gives the cost borne by the community to fill the service level gap (if any) pertaining to the inadequacy in supply of enough water to the community by the government. Table-2 gives the level of service in each village that were determined using the overall parameters like Quantity, Quality, Accessibility and Reliability/ Dependability as proposed in the WASHCost study.
Table-2: Service level of water supply in sample villages
|
Chinna Karumpalam |
Halorai |
Javana Gowder Lane |
||
|
Spring |
Spring |
Well |
Well |
|
| Quantity |
≥40 lpcd |
≥5 lpcd |
≥20 lpcd |
≥5 lpcd |
| Quality |
Good |
Good |
Acceptable |
Problematic |
| Accessibility |
≤30 mpcd |
≤10 mpcd |
≤30 mpcd |
≤30 mpcd |
| Reliability |
Reliable |
Reliable |
Reliable |
Problematic |
| Service level status |
Improved |
Improved |
Unimproved |
|
Note:*Quantity of water is measured in terms of liters per capita per day (lpcd).
*Accessibility of water is measured in terms of minutes per capita per day (mpcd).
*If the service level is high, intermediate or basic it is counted as ‘Improved’ status and ‘Unimproved’ for sub-standard and no service.
In the pilot study, it was seen that the people in the villages which were completely or partially dependent on springs spend less than the village which had only dug-well as the source for the water supply system. More accurate cost analysis could be estimated with the maintenance of regular pumping logs or automated water level monitors at source. It also throws light on the stability and reliability of natural springs which is under the threat of disappearance due to land encroachments for commercial and other purposes.
The detailed report and other documents are available online here.
Shanmitha Raghu
